Debugging Workflows
You can debug the workflows you design in Workflow Studio using either the CLR Debugger or Visual Studio. This allows you to step through workflow code to observe the outcome of your code and pinpoint any issues with the workflow.
This topic demonstrates how to debug a workflow using Visual Studio.
To debug a workflow
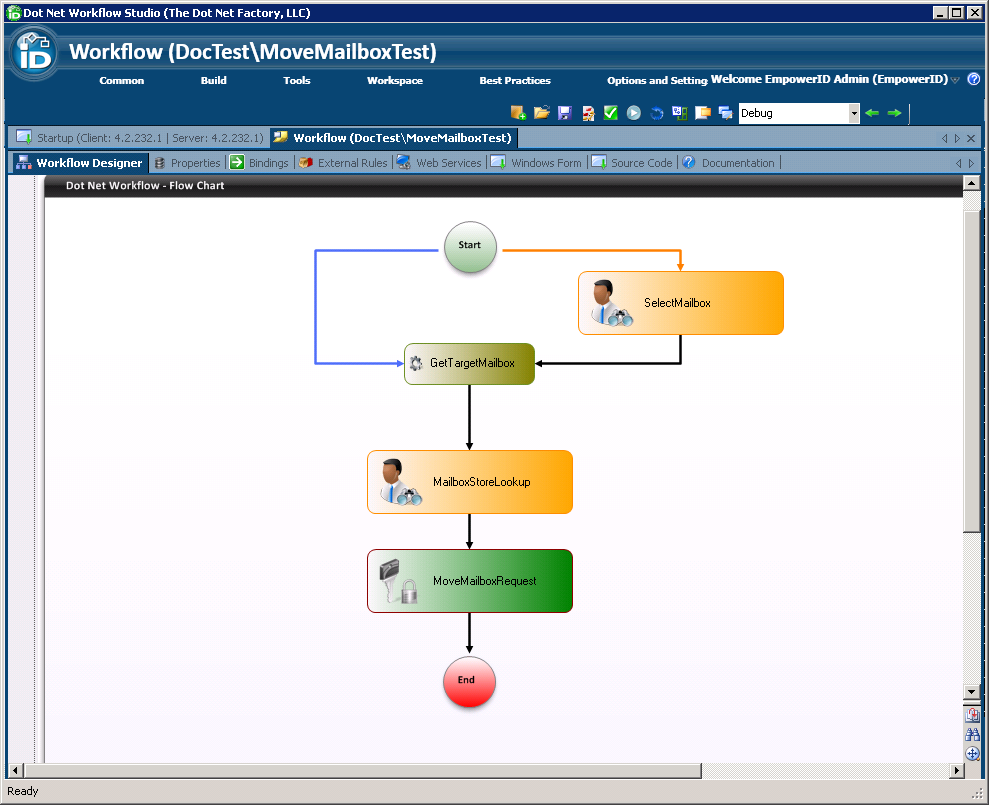
- Compile and publish the workflow you wish to debug to the Workflow Server and restart the Web Role Service. In our example, we debug a test workflow that moves a user mailbox.
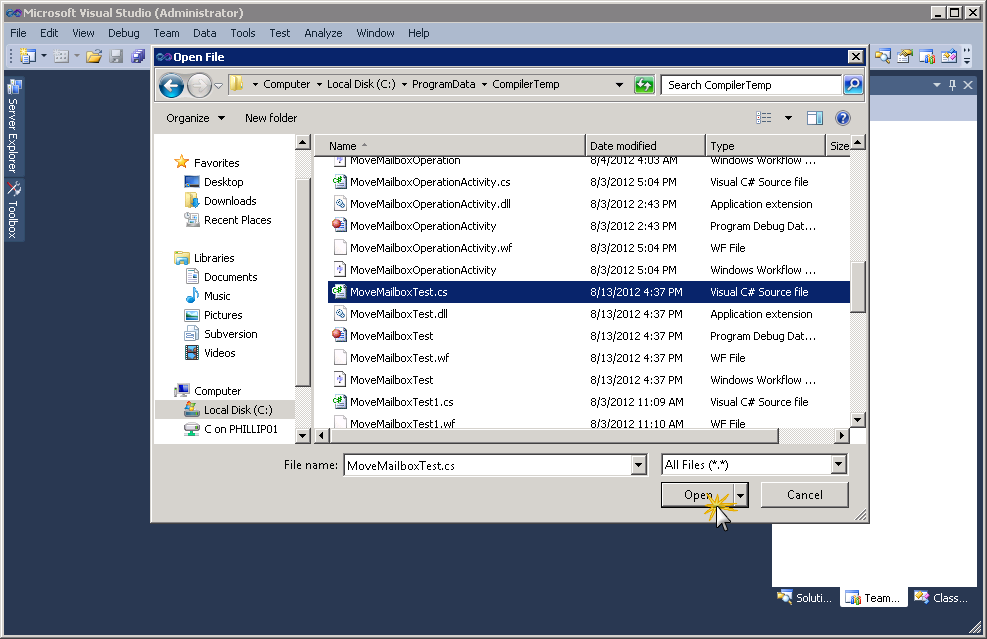
- Start Visual Studio and from the File menu, select Open > File, navigate to "C:\ProgramData," select CompilerTemp in the Open File dialog and then click Open.
- From the CompilerTemp folder, select the .cs file for the Workflow you want to debug and then click Open.
- Click No on the Inconsistent Line Ending dialog that appears.
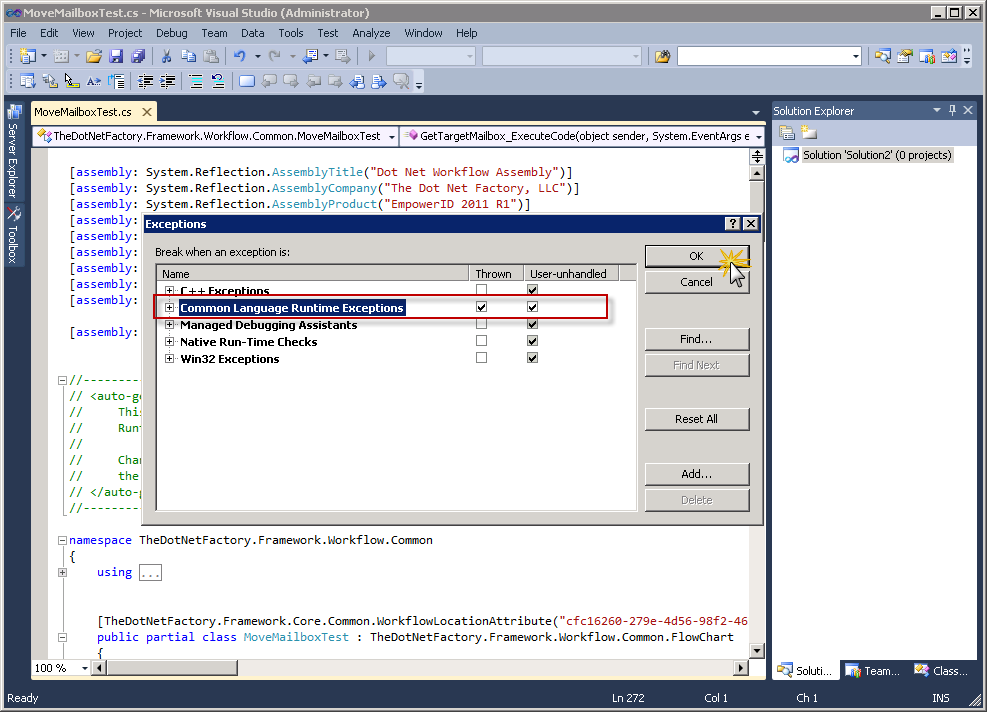
- From the Debug menu of Visual Studio, click on the Exceptions menu item, select the Thrown and User-unhandled options for Common Language Runtime Exceptions and then click OK.
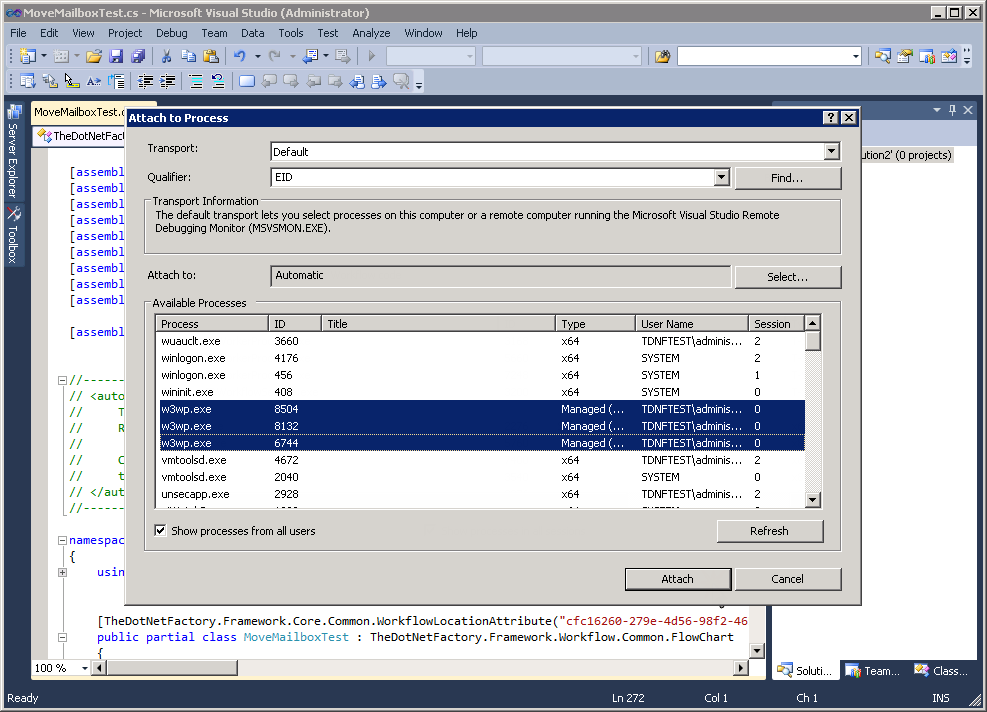
- From the Debug menu of Visual Studio, click on the Attach to Process menu item, select all w3wp.exe processes in the Available Processes pane and then click Attach.
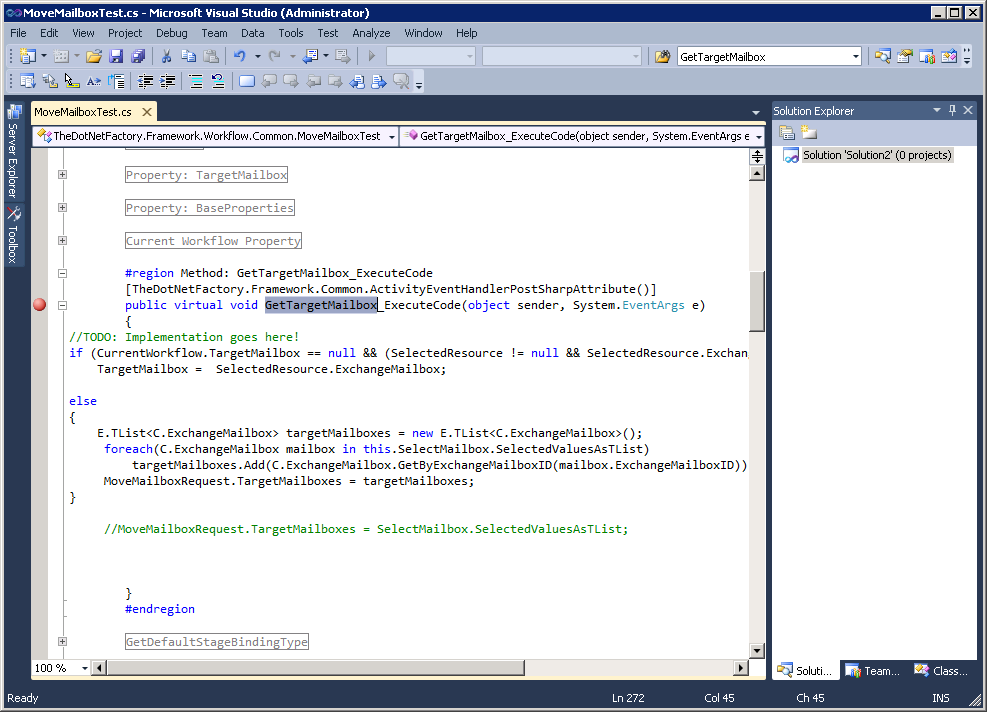
- From the cs file for the workflow, place a breakpoint in the code editor where desired. In our example, we place a breakpoint beside the method that is called when the workflow reaches the SelectMailbox lookup (GetTargetMailbox).
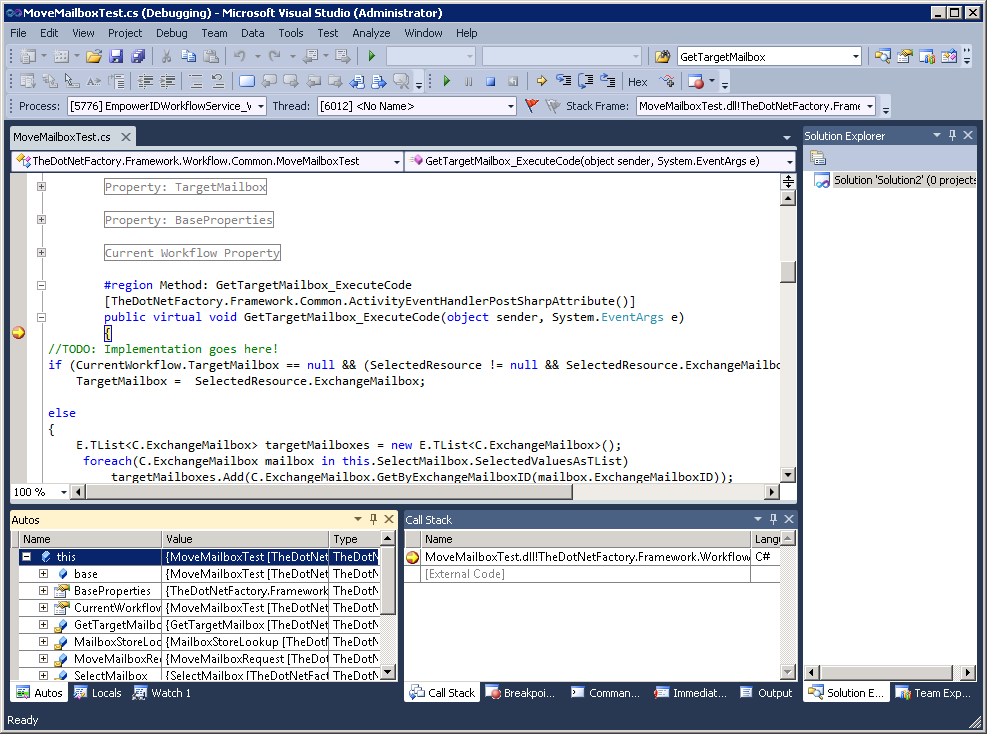
Run the workflow. When the workflow process reaches the breakpoint placed in the .cs file, the process will stop, allowing you to step through the code and observe what is occurring from Visual Studio.
If you make changes to the source code for the workflow, be sure to republish the workflow. Otherwise, the symbols used when debugging will not match.
, multiple selections available,